
Ministry of Commerce & Industry

The cumulative exports (merchandise & services) during April-February 2025-26 is estimated at US$ 790.86 Billion, as compared to US$ 747.58 Billion in April-February 2024-25, an estimated growth of 5.79%.
The cumulative value of merchandise exports during April-February 2025-26 was US$ 402.93 Billion, as compared to US$ 395.66 Billion during April-February 2024-25, registering a positive growth of 1.84%.
The cumulative Non-Petroleum exports in April-February 2025-26 valued at US$ 354.12 Billion registered an increase of 5.03% as compared to US$ 337.17 Billion in April-February 2024-25.
Major drivers of merchandise exports growth in February 2026 include Engineering Goods, Electronic Goods, Organic & Inorganic Chemicals, Gems & Jewellery and Meat, Dairy & Poultry Products.
Engineering Goods exports increased by 12.90 % from US$ 9.17 Billion in February 2025 to US$ 10.36 Billion in February 2026.
Electronic Goods exports increased by 10.37 % from US$ 3.79 Billion in February 2025 to US$ 4.18 Billion in February 2026.
Organic & Inorganic Chemicals exports increased by 6.85 % from US$ 2.23 Billion in February 2025 to US$ 2.38 Billion in February 2026.
Gems & Jewellery exports increased by 4.08 % from US$ 2.53 Billion in February 2025 to US$ 2.64 Billion in February 2026.
Meat, Dairy & Poultry Products exports increased by 22.66 % from US$ 0.45 Billion in February 2025 to US$ 0.55 Billion in February 2026.
Posted On: 16 MAR 2026 3:54PM by PIB Delhi
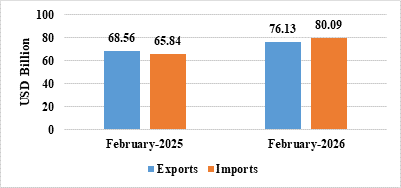
- India’s total exports (Merchandise and Services combined) for February 2026* is estimated at US$ 76.13 Billion, registering a positive growth of 11.05 percent vis-à-vis February 2025. Total imports (Merchandise and Services combined) for February 2026* is estimated at US$ 80.09 Billion, registering a positive growth of 21.64 percent vis-à-vis February 2025.
Table 1: Trade during February 2026*
|
February 2026 (US$ Billion) |
February 2025 (US$ Billion) |
||
|
Merchandise |
Exports |
36.61 |
36.91 |
|
Imports |
63.71 |
51.33 |
|
|
Services* |
Exports |
39.53 |
31.65 |
|
Imports |
16.38 |
14.51 |
|
|
Total Trade (Merchandise +Services) * |
Exports |
76.13 |
68.56 |
|
Imports |
80.09 |
65.84 |
|
|
Trade Balance |
-3.96 |
2.72 |
* Note: The latest data for services sector released by RBI is for January 2026. The data for February 2026 is an estimation. (ii) Data for April-February 2024-25 and April-December 2025 has been revised on pro-rata basis using quarterly balance of payments data.
Fig 1: Total Trade during February 2026*
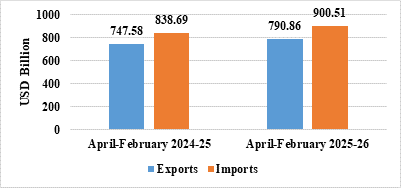
- India’s total exports during April-February 2025-26* is estimated at US$ 790.86 Billion registering a positive growth of 5.79 percent. Total imports during April-February 2025-26* is estimated at US$ 900.51 Billion registering a growth of 7.37 percent.
Table 2: Trade during April-February 2025-26*
|
April-February 2025-26 (US$ Billion) |
April-February 2024-25 (US$ Billion) |
||
|
Merchandise |
Exports |
402.93 |
395.66 |
|
Imports |
713.53 |
657.46 |
|
|
Services* |
Exports |
387.93 |
351.93 |
|
Imports |
186.98 |
181.23 |
|
|
Total Trade (Merchandise +Services) * |
Exports |
790.86 |
747.58 |
|
Imports |
900.51 |
838.69 |
|
|
Trade Balance |
-109.64 |
-91.11 |
Fig 2: Total Trade during April-February 2025-26*
MERCHANDISE TRADE
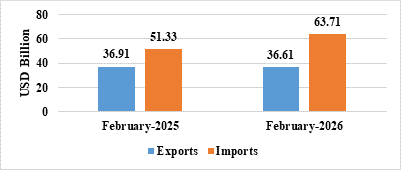
- Merchandise exports during February 2026 were US$ 36.61 Billion as compared to US$ 36.91 Billion in February 2025.
- Merchandise imports during February 2026 were US$ 63.71 Billion as compared to US$ 51.33 Billion in February 2025.
Fig 3: Merchandise Trade during February 2026
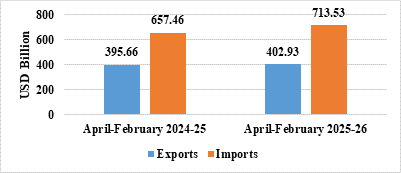
- Merchandise exports during April-February 2025-26 were US$ 402.93 Billion as compared to US$ 395.66 Billion during April-February 2024-25.
- Merchandise imports during April-February 2025-26 were US$ 713.53 Billion as compared to US$ 657.46 Billion during April-February 2024-25.
- Merchandise trade deficit during April-February 2025-26 was US$ 310.60 Billion as compared to US$ 261.80 Billion during April-February 2024-25.
Fig 4: Merchandise Trade during April-February 2025-26
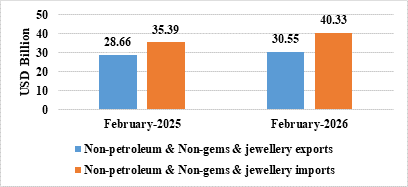
- Non-petroleum and non-gems & jewellery exports in February 2026 were US$ 30.55 Billion compared to US$ 28.66 Billion in February 2025.
- Non-petroleum, non-gems & jewellery (gold, silver & precious metals) imports in February 2026 were US$ 40.33 Billion compared to US$ 35.39 Billion in February 2025.
Table 3: Trade excluding Petroleum and Gems & Jewellery during February 2026
February 2026(US$ Billion) |
February 2025 (US$ Billion) |
|
|
Non- petroleum exports |
33.18 |
31.19 |
|
Non- petroleum imports |
50.74 |
39.44 |
|
Non-petroleum & Non-Gems & Jewellery exports |
30.55 |
28.66 |
|
Non-petroleum & Non-Gems & Jewellery imports |
40.33 |
35.39 |
Note: Gems & Jewellery Imports include Gold, Silver & Pearls, precious & Semi-precious stones
Fig 5: Trade excluding Petroleum and Gems & Jewellery during February 2026
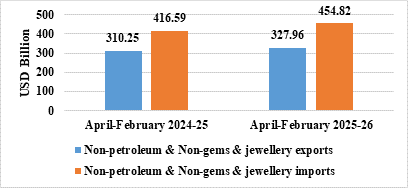
- Non-petroleum and non-gems & jewellery exports in April-February 2025-26 were US$ 327.96 Billion, compared to US$ 310.25 Billion in April-February 2024-25.
- Non-petroleum, non-gems & jewellery (gold, silver & precious metals) imports in April-February 2025-26 were US$ 454.82 Billion, compared to US$ 416.59 Billion in April-February 2024-25.
Table 4: Trade excluding Petroleum and Gems & Jewellery during April-February 2025-26
April-February 2025-26(US$ Billion) |
April-February 2024-25 (US$ Billion) |
|
|
Non- petroleum exports |
354.12 |
337.17 |
|
Non- petroleum imports |
551.75 |
490.69 |
|
Non-petroleum & Non Gems & Jewellery exports |
327.96 |
310.25 |
|
Non-petroleum & Non Gems & Jewellery imports |
454.82 |
416.59 |
Note: Gems & Jewellery Imports include Gold, Silver & Pearls, precious & Semi-precious stones
Fig 6: Trade excluding Petroleum and Gems & Jewellery during April-February 2025-26
SERVICES TRADE
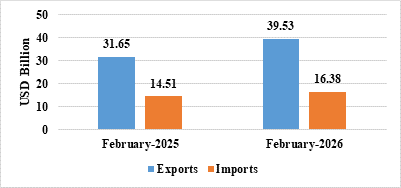
- The estimated value of services export for February 2026* is US$ 39.53 Billion as compared to US$ 31.65 Billion in February 2025.
- The estimated value of services imports for February 2026* is US$ 16.38 Billion as compared to US$ 14.51 Billion in February 2025.
Fig 7: Services Trade during February 2026*
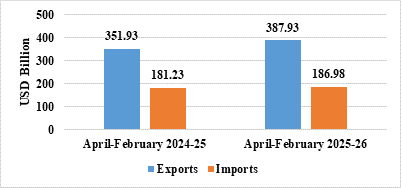
- The estimated value of service exports during April-February 2025-26* is US$ 387.93 Billion as compared to US$ 351.93 Billion in April-February 2024-25.
- The estimated value of service imports during April-February 2025-26* is US$ 186.98 Billion as compared to US$ 181.23 Billion in April-February 2024-25.
- The services trade surplus for April-February 2025-26* is US$ 200.96 Billion as compared to US$ 170.69 Billion in April-February 2024-25.
Fig 8: Services Trade during April-February 2025-26*
- Exports of Other Cereals (170.14%), Coffee (31.92%), Meat, Dairy & Poultry Products (22.66%), Marine Products (13.27%), Engineering Goods (12.9%), Mica, Coal & Other Ores, Minerals Including Processed Minerals (10.51%), Electronic Goods (10.37%), Handicrafts Excl. Hand Made Carpet (10.25%), Organic & Inorganic Chemicals (6.85%), Ceramic Products & Glassware (6.36%), Gems & Jewellery (4.08%), Fruits & Vegetables (3.95%), Drugs & Pharmaceuticals (3.4%), Cereal Preparations & Miscellaneous Processed Items (3.25%) and Rice (0.7%) record positive growth during February 2026 over the corresponding month of last year.
- Imports of Project Goods (-81.31%), Cotton Raw & Waste (-59.44%), Pulses (-38.49%), Newsprint (-34.12%), Transport Equipment (-23.64%), Chemical Material & Products (-13.08%), Pulp And Waste Paper (-9.24%) and Wood & Wood Products (-1.59%) record negative growth during February 2026 over the corresponding month of last year.
- Services exports is estimated to grow by 10.23 percent during April-February 2025-26* over April-February 2024-25.
- Top 5 export destinations, in terms of change in value, exhibiting positive growth in February 2026 vis a vis February 2025 are China P Rp (32.37%), Hong Kong (32.14%), Vietnam Soc Rep (49.46%), Togo (110.96%) and Sri Lanka Dsr (57.3%).
- Top 5 export destinations, in terms of change in value, exhibiting positive growth in April-February 2025-26 vis a vis April-February 2024-25 are China P Rp (37.66%), U S A (3.84%), U Arab Emts (8.52%), Spain (45.31%) and Hong Kong (30.91%).
- Top 5 import sources, in terms of change in value, exhibiting growth in February 2026 vis a vis February 2025 are China P Rp (30.49%), Switzerland (719.3%), U K (202.59%), U S A (36.53%) and Peru (377.65%).
- Top 5 import sources, in terms of change in value, exhibiting growth in April-February 2025-26 vis a vis April-February 2024-25 are China P Rp (15.21%), U S A (15.65%), U Arab Emts (10%), Hong Kong (25.01%) and Peru (67%).
********
Abhishek Dayal/Anushka Pandey
(Release ID: 2240674) Visitor Counter : 299